 The preliminary results are in from the 2014 BlackRock City census. Some key highlights:
- 62.41% Virgins or Noobz
- 37.59% Veterans – up from 29%, reflecting the population surge of the last couple of years, or the discrepancy between counting “number of years since first” and “number of burns”.
The number of kids was 4.1% of the population when we first started raising awareness about the unsuitability of this event for children. Now it’s down to 1.4%. That’s still 1000 kids too many, taking tickets away from sherpas Burners.
Re-blogged from BlackRock City Census:
 The online survey is now live at http://census.burningman.com and we encourage all 2014 citizens of Black Rock City to complete a survey as soon as possible so that your voices are represented in the 2014 report. Results won’t be ready until after the online instrument closes.
For the burning-data curious, we have some preliminary results for you! For the past 3 events, the Black Rock City Census Lab has randomly sampled entering participants through Gate Road. In addition, for the first time this year, we surveyed riders entering through Burner Express Buses (BxB). From these shorter, demographic surveys we get a baseline demographic profile that helps us weight the online survey. This post is a preliminary insight into the participants who attended the event in 2014 taken from this data.
This post reflects information collected from 1,367 entering participants randomly sampled at Gate Road from Friday pre-event through Wednesday mid-burn and 1,239 riders of BxB entering from Reno and San Francisco from Saturday, pre-event through Wednesday.
Though these results are preliminary, they do provide some new insights into the steady evolution of the event.
70% of Burners are in the highly marketable 20-40 age demographic. 20% are from another country (BMOrg lacks the ability to mail tickets to other countries, so all of these Burners have to go to Will Crawl).
A quarter of Burners are over 40, I wonder what percent of these are in RVs.
Demographics
Age
The median age this year is between 32 and 33, a little younger than last year.
| _0_19 | 1.41% |
| _20_29 | 38.15% |
| _30_39 | 33.60% |
| _40_49 | 14.18% |
| _50_or_more | 12.66% |
What with all the Broners and Next-Gen Tech Gurus, it’s becoming a bit of a sausage fest.
Gender
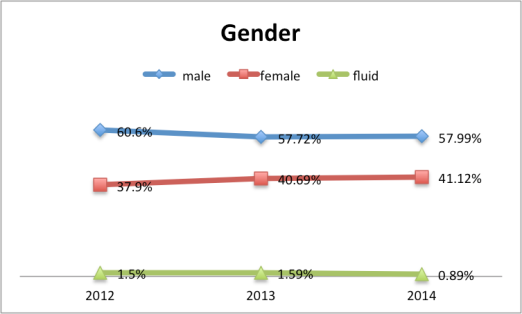
Percentage of women at the event increased another percentage point to 41%
| female | 41.12% |
| male | 57.99% |
| fluid | 0.89% |
“Time Since First Burn” is different from “number of burns”. We define “Veteran” as having been more than twice. Substitute “years” for “burns”, and we have 62.41% noobs, 37.59% Veterans.
Time Since First Burn
Virgin population continues to increase up from 36% two years ago, to nearly 41% of the population in 2014.
| virgin | 40.69% |
| _1or2years | 21.72% |
| _3or4years | 12.66% |
| _5to7years | 9.90% |
| _8to11years | 6.14% |
| _12to15years | 6.45% |
| _16or_more | 2.44% |
Half the Burners are from California. There are as many from Canada, as from Nevada.
Language and Residence
Where do you reside?
California and Nevada residents continue to dominate the event.
| NV | 6.49% |
| CA | 47.44% |
| US other | 26.57% |
| Canada | 6.12% |
| Other | 13.37% |
Foreign residents
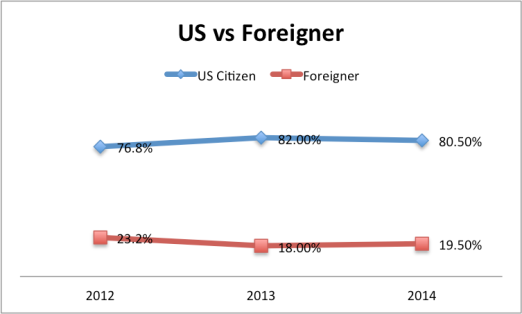
After declining from 2012 to 2013, foreign participants rose to 19.5% in 2014.
Supposedly, 6.37% of Burners got their ticket through STEP. At 68,000 paid participants, that would be 4332 tickets. Official numbers are 1500. Of course, not everyone at Burning Man did the census, so this shows you the sort of errors there can be in these statistics, which are simply estimates.
0.68% of people were there without a ticket, this is 476 out of the maximum peak population (including volunteers) of 70,000. Workers like LEOs may have done the survey, feeling they are Burners too.
With 2624 tickets bought for above face value, the Census claim the data shows that scalping is not an issue. Which it never was. About 5% bought tickets from a reseller or stranger. 25% got their tickets from someone known, which is 17,000 people. That’s a lot of Burner to Burner sales going on, did every Burner purchase an extra ticket? There were only 38,000 available in the “individual” sale.
Purchasing your ticket
Nearly 4% bought tickets for more than face value. Presumably this includes anyone who paid $650 to BMOrg for a scalper Exception ticket.
A vast majority (2/3) purchased their ticket this year from the Burning Man organization either directly or through the STEP program. Nearly 25% purchased their ticket from someone known to them. The growth of STEP coincides with a 50% drop in purchases from Strangers (potential scalpers) when compared with data from 2012. Additionally, 92% obtained their ticket for face value or less. Though the remainder who weren’t lucky enough to receive their ticket this way may feel frustrated, the data indicates that the issue of scalping has been mitigated significantly.
Where did you buy?
| BM | 60.57% |
| STEP | 6.37% |
| Someone_known | 24.56% |
| Stranger | 3.26% |
| Reseller | 1.46% |
| IDK | 0.56% |
| No_ticket | 0.68% |
| Other | 2.55% |
How much did you pay?
| Less | 6.51% |
| Face value | 79.15% |
| More | 3.86% |
| Gift | 6.52% |
| IDK | 0.98% |
| Other | 2.98% |
.
Politics
Almost 10% of Burners support “alternative” political parties. Only 4.4% vote Republican. Now we know why Larry was so keen to bring Grover Norquist out, and the PR blitz around it was so strong. Perhaps by associating themselves publicly with Burning Man, Republicans can seem more “hip” to the political base that voted the Democrats into power.
Politically, burners have historically been significantly more likely to vote than the default US population. This year, we again see that 85% of those eligible to vote in US elections actually do. Moreover, a 51% majority voted in at least 3 of the last 4 federal elections, significantly above the US population.
Another interesting fact to note is that, for the first time, US voting participants, when asked about party affiliation, chose “unaffiliated” (nearly 41% of eligible voters) in larger numbers than any other political party, reflecting a broad trend of dissatisfaction with US political parties. The combination of being such a strong voting population and also being unaffiliated may imply that politicians need to pay attention to their Burner voters in their district. This maybe especially wise in Nevada and California where Burners represent a non-trivial portion of their constituencies.
Political Party Affiliation
| Not_eligible | 23.27% |
| Democratic | 30.86% |
| Republican | 4.40% |
| Libertarian | 3.74% |
| Green | 2.36% |
| American_Ind_Party | 1.58% |
| Other | 1.60% |
| Unaffiliated | 31.57% |
| Multiple | 0.62% |


