2014 Census Results

black rock city censusThe preliminary results are in from the 2014 BlackRock City census. Some key highlights:

  • 62.41% Virgins or Noobz
  • 37.59% Veterans  – up from 29%, reflecting the population surge of the last couple of years, or the discrepancy between counting “number of years since first” and “number of burns”.

The number of kids was 4.1% of the population when we first started raising awareness about the unsuitability of this event for children. Now it’s down to 1.4%. That’s still 1000 kids too many, taking tickets away from sherpas Burners.

Re-blogged from BlackRock City Census:

census centaurThe online survey is now live at http://census.burningman.com and we encourage all 2014 citizens of Black Rock City to complete a survey as soon as possible so that your voices are represented in the 2014 report. Results won’t be ready until after the online instrument closes.

For the burning-data curious, we have some preliminary results for you! For the past 3 events, the Black Rock City Census Lab has randomly sampled entering participants through Gate Road. In addition, for the first time this year, we surveyed riders entering through Burner Express Buses (BxB). From these shorter, demographic surveys we get a baseline demographic profile that helps us weight the online survey. This post is a preliminary insight into the participants who attended the event in 2014 taken from this data.

This post reflects information collected from 1,367 entering participants randomly sampled at Gate Road from Friday pre-event through Wednesday mid-burn and 1,239 riders of BxB entering from Reno and San Francisco from Saturday, pre-event through Wednesday.

Though these results are preliminary, they do provide some new insights into the steady evolution of the event.


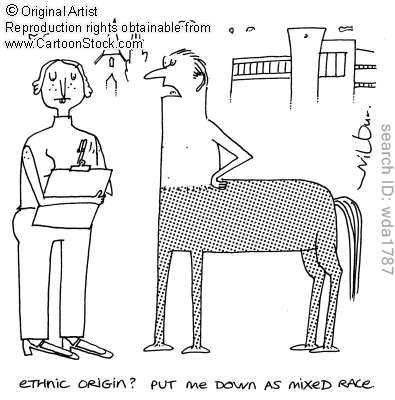
70% of Burners are in the highly marketable 20-40 age demographic. 20% are from another country (BMOrg lacks the ability to mail tickets to other countries, so all of these Burners have to go to Will Crawl).

A quarter of Burners are over 40, I wonder what percent of these are in RVs.


Demographics

Age

The median age this year is between 32 and 33, a little younger than last year.

_0_19 1.41%
_20_29 38.15%
_30_39 33.60%
_40_49 14.18%
_50_or_more 12.66%

Age


What with all the Broners and Next-Gen Tech Gurus, it’s becoming a bit of a sausage fest.


Gender

Percentage of women at the event increased another percentage point to 41%

female 41.12%
male 57.99%
fluid 0.89%

Gender


“Time Since First Burn” is different from “number of burns”. We define “Veteran” as having been more than twice. Substitute “years” for “burns”, and we have 62.41% noobs, 37.59% Veterans.

Time Since First Burn

Virgin population continues to increase up from 36% two years ago, to nearly 41% of the population in 2014.
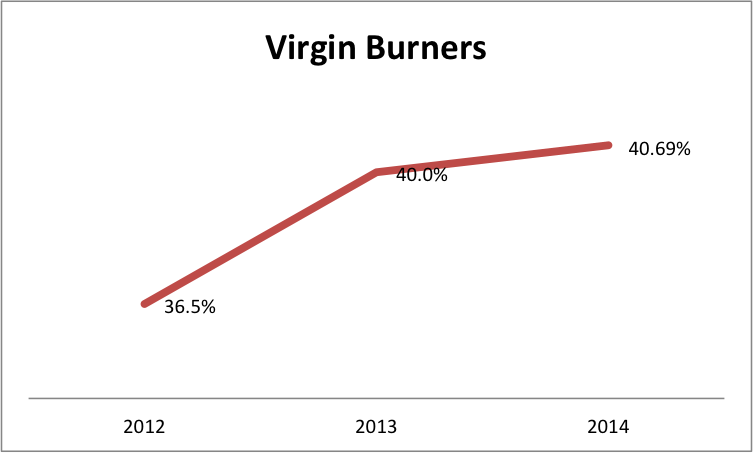
Virgins

virgin 40.69%
_1or2years 21.72%
_3or4years 12.66%
_5to7years 9.90%
_8to11years 6.14%
_12to15years 6.45%
_16or_more 2.44%

Half the Burners are from California. There are as many from Canada, as from Nevada.


Language and Residence

Where do you reside?

California and Nevada residents continue to dominate the event.

NV 6.49%
CA 47.44%
US other 26.57%
Canada 6.12%
Other 13.37%

Residence

Foreign residents

After declining from 2012 to 2013, foreign participants rose to 19.5% in 2014.

Foreign


Supposedly, 6.37% of Burners got their ticket through STEP. At 68,000 paid participants, that would be 4332 tickets. Official numbers are 1500. Of course, not everyone at Burning Man did the census, so this shows you the sort of errors there can be in these statistics, which are simply estimates.

0.68% of people were there without a ticket, this is 476 out of the maximum peak population (including volunteers) of 70,000. Workers like LEOs may have done the survey, feeling they are Burners too.

With 2624 tickets bought for above face value, the Census claim the data shows that scalping is not an issue. Which it never was. About 5% bought tickets from a reseller or stranger. 25% got their tickets from someone known, which is 17,000 people. That’s a lot of Burner to Burner sales going on, did every Burner purchase an extra ticket? There were only 38,000 available in the “individual” sale.


Purchasing your ticket

Nearly 4% bought tickets for more than face value. Presumably this includes anyone who paid $650 to BMOrg for a scalper Exception ticket.

A vast majority (2/3) purchased their ticket this year from the Burning Man organization either directly or through the STEP program. Nearly 25% purchased their ticket from someone known to them. The growth of STEP coincides with a 50% drop in purchases from Strangers (potential scalpers) when compared with data from 2012. Additionally, 92% obtained their ticket for face value or less. Though the remainder who weren’t lucky enough to receive their ticket this way may feel frustrated, the data indicates that the issue of scalping has been mitigated significantly.


Where did you buy?

BM 60.57%
STEP 6.37%
Someone_known 24.56%
Stranger 3.26%
Reseller 1.46%
IDK 0.56%
No_ticket 0.68%
Other 2.55%


How much did you pay?

Less 6.51%
Face value 79.15%
More 3.86%
Gift 6.52%
IDK 0.98%
Other 2.98%

 Where did you get your ticket (2012 vs 2014)?

 .


Politics

Almost 10% of Burners support “alternative” political parties. Only 4.4% vote Republican. Now we know why Larry was so keen to bring Grover Norquist out, and the PR blitz around it was so strong. Perhaps by associating themselves publicly with Burning Man, Republicans can seem more “hip” to the political base that voted the Democrats into power.


Politically, burners have historically been significantly more likely to vote than the default US population. This year, we again see that 85% of those eligible to vote in US elections actually do. Moreover, a 51% majority voted in at least 3 of the last 4 federal elections, significantly above the US population.

Another interesting fact to note is that, for the first time, US voting participants, when asked about party affiliation, chose “unaffiliated” (nearly 41% of eligible voters) in larger numbers than any other political party, reflecting a broad trend of dissatisfaction with US political parties. The combination of being such a strong voting population and also being unaffiliated may imply that politicians need to pay attention to their Burner voters in their district. This maybe especially wise in Nevada and California where Burners represent a non-trivial portion of their constituencies.

Political Party Affiliation

 Not_eligible 23.27%
 Democratic 30.86%
 Republican 4.40%
 Libertarian 3.74%
 Green 2.36%
American_Ind_Party 1.58%
 Other 1.60%
 Unaffiliated 31.57%
 Multiple 0.62%

1st world problems

More Math(s)

Our post 60% Veterans has generated some further discussion and analysis.

Hunter from the Official BRC Census (2012 variant) came to comment:

Hi there, here’s Hunter from the Census Lab. I’m one of the research collaborator and I’ve been in charge of the Census databases since 2012 (i.e., when we started correcting the Census for sampling biases by doing a random sampling of burners at the gate during ingress). I won’t comment in details, but here’s a brief summary of my point of view on the subject.
The question is quite interesting (is there a bias towards virgins?), but, as mentioned above, the math/s are wrong. There is indeed a large proportion of newbies at BM (more or less between 30% and 40% every year, at least for the recent years) and I was surprised to see that at the beginning.
However, it is totally impossible to estimate the probability of getting a ticket without knowing how many veterans vs newbies tried to get a ticket. Also, you seem to believe that veterans (3+y) try to go every year if they can, but this is not what we see in the Census. Even if we take into account only the years before tickets went sold out, the Census data suggest that most veterans skipped one or more years. It might not be the case for highly involved veterans like you or those around you, though.
Also, we have to take into account the fact that the publicity that BM got in the recent years due to some viral videos, documentaries and media coverage probably increased extremely the number of non-burners who would like to go to BM “at least once”.
If we had access to the burner profile database (and no, I don’t have that kind of access), it might be possible to estimate the probability of getting a ticket as a fonction of number of playa years, but I don’t see how it could be done from the Census data.
All in all, I’m not convinced by the data that the probability of getting a ticket if one wants a ticket is higher for newbies than it is for veterans, especially if we take into account a few elements such as:
– the growing number of interested non-burners
– the continuously increasing population in BRC
– the fact that veterans rarely come every year (especially “older” vets)
Also, IF the probabilities are skewed as you suggests, the Org is not necessary the culprit. Lets just remember that a very strong tradition in the BM culture is ticket gifting. Thus, veterans will often provide a ticket to a virgin friend to let them experience the event. Such a tradition definitely skews probability in favor of virgins by providing some of them with an easy access to a ticket, or at least a second chance to get one.

Finally, I’ll add a simple correction to your text. Your argument about BIG data suggests that the info collected via the Census, the burner profile and other Org-related projects end up in a big database in which everything can be analyzed and cross-referenced, but it’s hardly the case, at least for the Census. I’m not part of the Org, so I cannot tell what they do with the burner profile info. However, the Census data are kept separate from any other database and no email is in the database. The Census Lab provides the Org with the Census results, but the Census databases are under the responsibility of the Census Lab to insure a strict confidentiality of the data and respondents.

So, thanks for the topic, it looks like it sparked an interesting discussion. I hope that these clarifications were useful. If anyone of you wants to continue the discussion on playa, you are welcome to drop by the Census Lab (10:00 and Inner circle) and ask for Hunter.

Now just because someone affiliated with BMOrg says “you’re wrong”, doesn’t mean we’re wrong, as readers of this blog should know by now. Since my response got quite long, I’m making a post out of it.

Thanks for coming here to comment Hunter. The whole Burner community benefits from public discourse like this! We presume that helping the community is the reason why this data is being provided by Burners, and collected by your group and BMOrg – and why your group volunteers your time for free to help Burners understand the implications.

You dismsissed our post by saying “the math is wrong”, without any further explanation. I’m going to point out how your reasoning is wrong.

1. The last 3 years of Virgin data are 47%, 37%, 40%. I’m using this to say “40% Virgins”. I am not making that prediction just from 2 years of your census data, I am also making it from my analysis that “the Census data shows something more is going on here than random chance”.

2. You are responsible for the last two data sets, which are both under the new ticketing system. If this year’s data set also shows 40% virgins, this will be more evidence of something going on. Coincidences can’t just keep happening again and again the same way, at some point you have to wonder “maybe the data is being skewed somehow and this is not just random chance”. Who is responsible for the overall collection and analysis of Burning Man data, then? Because, they’re sure collecting a truckload of it.

3. Could you provide more details of how you bias the sample? Could the sampling bias of the gate survey have an impact on the 40% virgins? How large was the sample size for 2012 and 2013? Here’s what we have:

There was an inherent self-selection bias in past surveys
• 2012 complemented census with a random sampling at the gate
• Random sample allowed them to weight the collected data
• Variables used to weight the 2012 Census:
– Gender
– Age
– Are you a Virgin?
– Foreign
– English Speaker
– US Party Affiliation

How was this done? What was the difference in numbers of the “Are you a Virgin” question between the gate census and the Center Camp census? What does US Party Affiliation have to do with Census results?

4. You state “it is totally impossible to estimate ticket probability without knowing number of newbies trying and number of veterans trying”. You also admit you have no access to the database information from the Burner Profiles. So, if profile data was being used – algorithmically or manually – to influence the number of Virgins at the party, how would you be in a position to know, any more than we are? Are you saying “it is totally impossible that Burners who answer NEVER in their profile have an increased chance of getting a ticket”? No, you’re not. You’re actually saying “assuming this is all random chance, we need these numbers to make our prediction more accurate”. My entire post is saying “I don’t think this is random chance”.

5. I agree that estimating an attrition rate for veterans should be applied. Another commenter Cupcake has suggested 20%, which I am happy to run with. Your comment that “the two years of data I’m looking at from gate surveys of the new ticketing system say veterans don’t want to go back”, is analysis based on flawed reasoning. It could very well show that either a) veterans don’t care about completing your survey so much, or b) the system is skewed to prevent veterans from getting tickets, so they never arrive. How else can you know what the intentions of the 659,000 veterans were towards getting tickets?

6. You then say that “even looking at the years before, veterans skip years” – this may be true for some Veterans, but the population of Veterans is always growing.

7. You take BMOrg’s line that YouTube videos and media coverage have led to exploding newbie demand. From the earliest survey data we have, 2001, media coverage was the biggest reason people heard about BM (after Word of Mouth and Other). Despite what BM says on the ticket terms and conditions “The organization does little to solicit attention from television or media companies…and does not seek to artificially grow the event itself by exposure through the mass media”…BMOrg employs multiple PR people specifically for this purpose. The exposure has included Malcolm in the Middle, South Park, the Daily Show, Bloomberg and the Wall Street Journal, Town and Country and Vogue – all long before 2012. Mass media promotion seems to be a constant factor.

I note that when they first started this lottery thing, which was at the height of the YouTube and media blitz, the population of BRC actually dropped from the previous year – presumably because Veterans gave up when they couldn’t get tickets, and this had a ripple effect through the community. You’d think it would’ve continued to be a sold out event, if there was a massive population of Virgins wanting to go.

8. “The culture of gifting encourages people to give tickets to newbies”. I’ll concede that you could be right, but it’s hard to say how much of a factor this truly is. This is an area where it would be great to have the Burner Profile data. To me, it doesn’t sufficiently explain “a jump to 40% Virgins for the last 3 years in a row”. If anything, it would suggest that the Virgin percentage would have been much higher years ago, when the Veteran population was smaller (since you’re implying Veterans bring Virgins, and also Virgins bring Virgins).

9. You say that “data doesn’t end up in a big database”; at the same time you admit you don’t have access to BMOrg’s databases, and you don’t know what they do with the data once you provide it to them.


If less Veterans want to go because all BMOrg’s rules and procedures and new ticketing ideas have a negative effect on their motivation to return, this doesn’t change my point – the ticket sales are being manipulated to discourage Veterans and encourage Virgins. It would just be a different method, death by culture rather than death by algorithm.

bm shark jumpingWho is more motivated to create profiles and jump through all these hoops to get a ticket, Virgins, or Veterans? Maybe the veteran attrition rate is increasing, as “jumping the shark” becomes a catchphrase and publications like Salon and Vanity Fair proclaim “Burning Man is dead” – this makes Virgins want to go even more, and Veterans want to go even less. My personal view is that most people who make it out to Burning Man like it, and want to return. Hunter is right that maybe my bias is skewed by knowing a lot of Burners and writing a blog for Burners.

If there are always more Virgins who want to go than Veterans, then the ticket distribution will always be trending higher towards Virgins. Veterans is always growing, minus the attrition rate. This means that the number of Virgins who want to go each year has to be growing by more than the Veteran population, to keep the proportions the same. Virgins is growing, attribute that to media if you want, but surely there is a peak – not every person in the world wants to go to Burning Man. It seems like when they first started the lottery, more Veterans wanted to go than Virgins, and that is why the annual population shrank. In 2014, is Virgins who want to go, growing faster than Veterans who want to go? Will the growth rate of the former group slow down this year, because there wasn’t a Dr Seuss video?

One interpretation of the data could be “veterans are souring on the event, and their population is naturally declining, being replaced by Virgins”. However, I’m not making that interpretation. Mine is “Virgins are somehow deliberately being favored in the ticket allocation”. The most likely way I can see to influence that would be using the Burner profile information where you are specifically asked if you’re a Virgin, and if not to indicate all the years you attended.

We look forward to seeing the Census data from 2014.