Figures often beguile me, particularly when I have the arranging of them myself; in which case the remark attributed to Disraeli would often apply with justice and force: “There are three kinds of lies: lies, damned lies and statistics.” – Mark Twain
Have you been to Burning Man before? For many people at Burning Man, the answer is NO.
Last year we presented analysis of the Burner breakdown from the Census: 60% Veterans. In retrospect, the title is a little confusing. You see, according to the OFFICIAL presentation of numbers, it was 40% Virgins, meaning that everyone else had been to Burning Man at least once before. But looking at the number in a different light – defining “Veteran” as you’ve been to Burning Man twice, not once – gave us the surprising result that only 29% of people at Burning Man were Veterans.
Well, guess what? 2014’s numbers are out, attached to the now heavily redacted Afterburn Report. I must praise the BRC Census team for producing the most comprehensive and useful interpretation of Burner data since statistics collection began in 2001. There are some interesting nuggets within the 45-page document.
The most interesting is the % of Veterans. Has it improved on 29%?
Nope. It’s almost exactly the same. At least, it was…until the Statistics were “adjusted”.
I am not an expert in Statistics, but I did study it in my first year at college, so I have more than just a passing knowledge of the field. The main thing I know is that modern statistics have been designed to be easy to fudge. That’s why Obama can claim “unemployment at 6%”, when the real unemployment rate is over 12%. The statistics can be manipulated to come to whatever conclusion is most politically expedient.
In the case of Burning Man 2014, Burners filled in the Census results after the event at Burning Man’s web site. They received 11,909 responses, 1 in every 5.5 Burners. This puts the sample size at almost 20% , which is definitely large enough to be useful.
The Census takers then “corrected for bias”. This is a process in which statistics turns from a science into an art, and the number wizards can work their magic. Always justified in the name of “making the numbers more accurate”, a whole bunch of mathematics and other variables can be brought in, to shift the results in whatever direction is desired.
In the case of Burning Man, a random sampling from the gate was mixed with every person on Burner Express. They used 8 different variables for the data reconstruction bias adjustment:
Day of arrival versus number of participants arriving – Gender – Age – Virgin Burner or not – Foreigner or not – English Speaker as a first language or not – US Party Affiliation (if eligible to vote in the US) – Voting Behavior
The theory is that Burners who answer the survey, may not be representative of all Burners; whereas Burners on Burner Express are. We could debate that all day long, at least the natural and adjusted results are shown for us to compare.

According to the pollsters, the adjustment had a major effect on the % Virgins number: “Improvements in Weighting Procedure Impacted this Measure Significantly, Virgins -6% From Preliminary Results”.

Unadjusted: 28.1% Veterans, 71.9% newbies, 37% Virgins
Adjusted: 37.8% Veterans, 62.2% newbies, 35.1% Virgins
That is quite a swing – nearly 10% in the participation of Veterans. The results came in from 11,707 Burners – the most who had ever participated in the Census. The numbers were pretty much just the same as last year – just like Burners.Me has been saying. And then, a whole bunch of “adjustment for bias” is applied to the numbers, and all of a sudden, the results are completely different!
Not only that, there is a large discrepancy between the unadjusted number, and the 2014 “preliminary” number that was announced in September last year:

This post reflects information collected from 1,367 entering participants randomly sampled at Gate Road from Friday pre-event through Wednesday mid-burn and 1,239 riders of BxB entering from Reno and San Francisco from Saturday, pre-event through Wednesday.
So if the preliminary results were MORE Virgins, how can it be that the adjusted results are LESS Virgins? In the past, members of the Black Rock City Census team have commented here on our stories, so I invite them to #pleaseexplain.
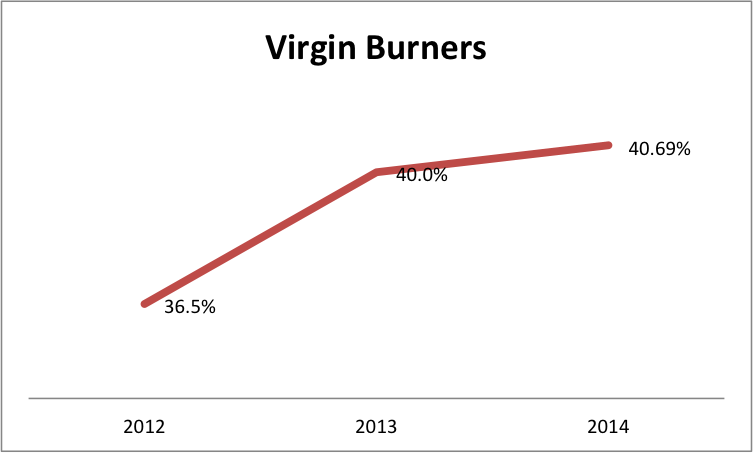
Whether it’s 35% Virgins, 37% Virgins, or 41% Virgins, doesn’t change my general point: every year, magically, mysteriously, it’s around 40% Virgins. And only 29% Veterans.
Some have accused me of being a “conspiracy theorist” for thinking that this massive correlation in supposedly random numbers suggests something is going on to ensure that the distribution is not entirely random. The system of Burner profiles was only introduced in the last few years. It makes you state how many times you have been to Burning Man, before you get through the definitely not First-In First-Out queue to get tickets. If you fail, you then take a place in the STEP queue – which we are led to believe is First-In, First-Out, but have absolutely zero information or evidence about. All we can go on is past behavior: if they have lied in the past, why should we assume they are telling the truth now?
I liken it to playing Roulette, and betting on Red vs Black. In theory, if you had 50 blacks in a row, it’s the same as if there was just 1: there’s still a 50/50 chance of it being Red or Black. At what point do you say “this machine looks like it’s broken, it lands on black every time, it can’t be just random”? After a million blacks in a row, do you still assume the machine is fine and it’s all just random chance? At some point it either shifts from “accident” to “miracle”, or from “accident” to “planned”. We now have 3 years in a row of 40% Virgins.
Whether you look at the biased or unbiased numbers, the fact remains: it is much harder for Veterans to go to Burning Man than Virgins. And every year, the population of Veterans increases. Presumably most Veterans want to go back. So over time, it should be the other way around: it should be getting harder and harder for Virgins to get tickets. Instead the influx of Virgins seems to be fixed, and not influenced by the massive growth in the Veteran population over the last few years. It is not easy for Veterans to go, yet it still seems very easy for newbies to get there.
In 2014, 3 out of 4 Burners in Black Rock City had not been there more than twice before.
The rest of the statistics show what most Burners already knew: Burning Man is a white, educated, affluent, liberal, gay, Californian event.
15% of Burners were from outside the US, 4.4% from Canada. French, Spanish, and Russian (in that order) were the most common first languages spoken, other than English.
44% of Burners were from California, 5% from Nevada.

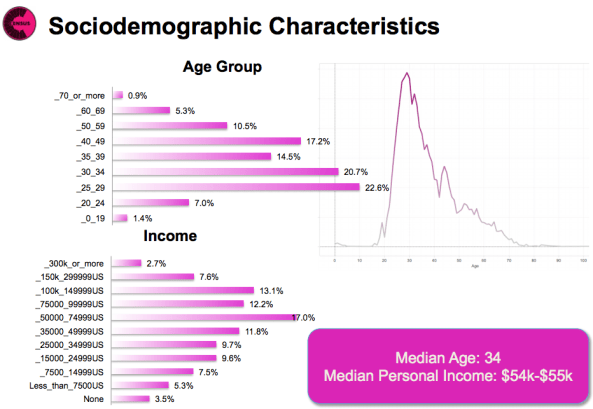
The income of Burners has been increasing. 2.7% earn more than $300,000 a year – that’s 1800 people, supporting my previous assertion that there are thousands of millionaires at Burning Man. Nearly a quarter of Burners earn six figure incomes.
The average Burner spent $639 in Nevada. A staggering 40% managed to attend Burning Man without spending more than $1000.

STEP came through for almost 4% of Burners: 2573 tickets.

This seems to add up with BMOrg’s claims, which suggests the unadjusted statistics are pretty accurate.

So 73 STEP tickets came from Burners selling back to the queue, and the rest came from the “surprise” find of tickets that BMOrg released once their VIP Donation promotion was over. Unless BMOrg add another 2,500 tickets to STEP again this year, I think it’s safe to say Burners in the STEP queue this year are unlikely to get tickets.
Nearly 60% of Burners were in camps of 20 people or more.

Only 5% of Burners didn’t have access to a bike. A third had some sort of solar, 44% had access to a camp generator and 19% to a vehicle generator. A full 6% of Burners were plugged into the BRC grid – nice action if you can get it.
42.1% of Burners report being worried about judgment or unfair treatment based on their participation in Burning Man.
Three quarters of Burners have college degrees, with a full quarter having a graduate degree. It also looks like a good place to get spa treatments…

According to their “weighted” statistics, it’s a sausage-fest – 60% male, only 40% female. More than 1% identify their gender as “fluid”, which must help with those portapotty lines. 69% are heterosexual, and 72% have no religion.


If Burning Man was a State, its 1.3% black population would rank it at #42 for racial integration. It would make #11 on the white population list, just beating Kentucky.
So much for Grover Norquist’s Dream Team and the Mainstream Republican Values of Burning Man. Black Rock City is full of left wing liberals, and skews heavily towards the democrats.


18% of Burners came in RVs. That is 12,000 people. 0.9% flew into Black Rock City airport, 593 people.

In 2007, the theme was The Green Man. As part of the celebrations, The Cooling Man did an analysis of greenhouse gas emissions from Burning Man. Their calculations went quite deep, estimating international and domestic air miles as well as use of generators on site. They estimated the average road miles per Burner as 654, which led to 16,500 tons of CO2 emissions based on a population of 40,000.
Cooling Man’s assumption was 0.0128 tons CO2e per gallon. Using BRC Census’s 320,000 gallons, that is 4,096 tons – so despite the population growth, Burning Man is getting greener.
Most Burners are Millenials – about 50% are in the age bracket 20-35.

According to the unweighted numbers, 0.5% of Burners were 19 or younger. Applying the bias adjustment nearly tripled this, to 1.4%. It is still an incredibly small number, given how much Burners have to sacrifice for kids to be there. Almost half of Burners are completely opposed to kids being at the party, nearly 60% when it comes to kids under the age of 5. A whopping 15% of Burners do not think that the Playa is a safe place for children, and only 20% think that it is.

Finally, it looks like more than 80% of Burners are using social media to get their Burning Man information.

They might as well give up on ePlaya, most Burners have never even looked at it. And if they did, they probably never went back. Burning Man Facebook pages and blogs are being visited by Burners more often than Burning Man’s own site.
There is more interesting information in the full 2014 Black Rock City Census Report.
[Update 4/8/15 1:24pm]
The Black Rock City Census site originally published these preliminary findings for 2014:
A vast majority (2/3) purchased their ticket this year from the Burning Man organization either directly or through the STEP program. Nearly 25% purchased their ticket from someone known to them. The growth of STEP coincides with a 50% drop in purchases from Strangers (potential scalpers) when compared with data from 2012. Additionally, 92% obtained their ticket for face value or less. Though the remainder who weren’t lucky enough to receive their ticket this way may feel frustrated, the data indicates that the issue of scalping has been mitigated significantly.
Where did you buy?
| BM |
60.57% |
| STEP |
6.37% |
| Someone_known |
24.56% |
| Stranger |
3.26% |
| Reseller |
1.46% |
| IDK |
0.56% |
| No_ticket |
0.68% |
| Other |
2.55% |
This would put the number of STEP tickets at 4200, meaning 2500 from BMOrg and 1700 from Burners. This seems a more probable number to me. So why the big swing – 6.4% from initial data, to 3.9% in the adjusted data? In a similar fashion, “Third Party reseller” went from 1.46% (963 tickets) to 0.7% (461 tickets).
Help others find Burners.Me
Like this:
Like Loading...


 [Source: Reddit, compiled from @bmantraffic hourly updates]